

Skip to content

AI COMPLIANCE

Know where AI stands.

Sign in to explore

Clear numbers.
Better decisions.

I build tools for pricing, AI, and risk.

Geometric reflections across a modern glass building
James Boggs · Florida · Remote-first

Margin & pricing

Find the gap.
See the impact.

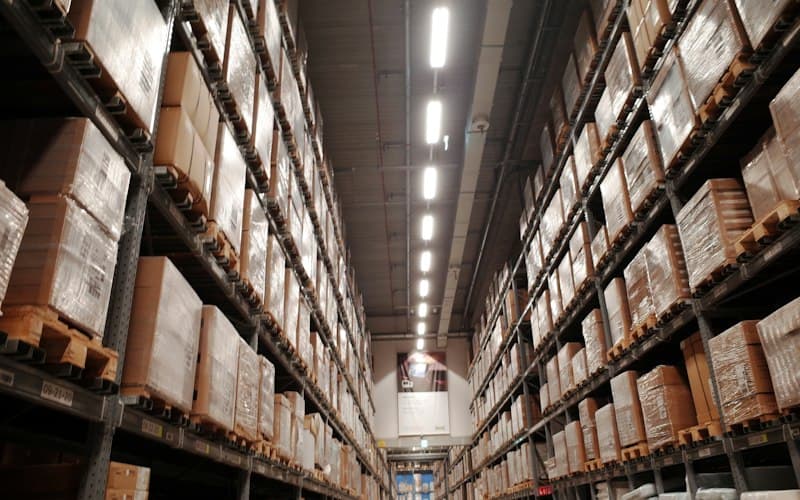
Warehouse aisles with stocked distribution shelves01 / HVAC distribution

Case study 01

HVAC distribution

More margin from every order.

$92K

Modeled annual EBITDA

+25% lift · 50% capture assumption

The opportunity.

  • Cut expedited freight.
  • Rein in account discounts.
  • Recover vendor cost increases.

Modeled annual EBITDA.

Cost containment (freight)$65.5K
Price optimization$55.9K
Discount discipline$40.8K
Cost pass-through$21.1K
Full opportunity$183K

+395 bps of annual revenue

Findings & assumptions

Six SKUs across Climate, Outdoor and Controls lines, six contractor accounts, 1,317 orders over 26 weeks. At 7.8% EBITDA, every point of gross margin matters: the engine sized four separate leaks worth almost 2 points of EBITDA margin in the conservative case.

Annual revenue $4.64MBaseline EBITDA $363K (7.8%)
Gross margin
33.9%Baseline, annualized
Conservative impact
+198 bps$92K EBITDA / yr
Orders below floor
24%153 orders under 28% GM
Quotes stopped
3 of 51 blocked, 2 routed to VP
Brightline Supply: discount creep
−15.5 pp GM

Average discount jumped from 8.1% to 21.3% starting the week of Sep 21 (z = 8.9). The decomposition puts 10.4 pp of the margin drop on discounting and 3.9 pp on extra support hours.

Action: Pricing review on the account; discounts beyond the floor require VP approval.

Outdoor line: expedited freight
−8.6 pp GM

Freight rose from about 3.5% to 11% of revenue on the Outdoor line from Sep 21; freight alone explains 7.5 pp of the drop.

Action: Audit carrier invoices and tighten approval of expedited shipments.

Climate line: vendor increase not passed through
$9.6K lost

Unit cost rose 4% on Aug 1. List prices did not move, so 0% of the increase reached customers over the following 72 days.

Action: Pass the cost increase through to price on SKUs the optimizer holds.

What matters

In distribution, the biggest wins were operational rather than list-price changes: freight and discount leaks together are worth more than the price changes. Stopping them early matters because the engine dates when each problem began, so it can be fixed within weeks instead of found at quarter close.

Price recommendations.

Elasticity estimated per SKU from order-level price and volume, controlling for month and weekday. Five of six SKUs have room to raise price; the margin-maximizing move on SKU-110 is +10% even after losing about 18% of volume.

SKUElasticityNet priceRecommendedVolumeGM uplift / yrCall
SKU-1102.06$624.84$687.33−17.9%$37.5KRaise
SKU-3001.16$55.73$61.30−10.5%$12.9KRaise
SKU-3102.27$220.38$240.44−17.9%$2.7KRaise
SKU-2002.78$137.87$148.20−18.2%$2.6KRaise
SKU-2103.00$88.28$90.22−6.3%$0.2KRaise
SKU-1000.90$390.77---Hold
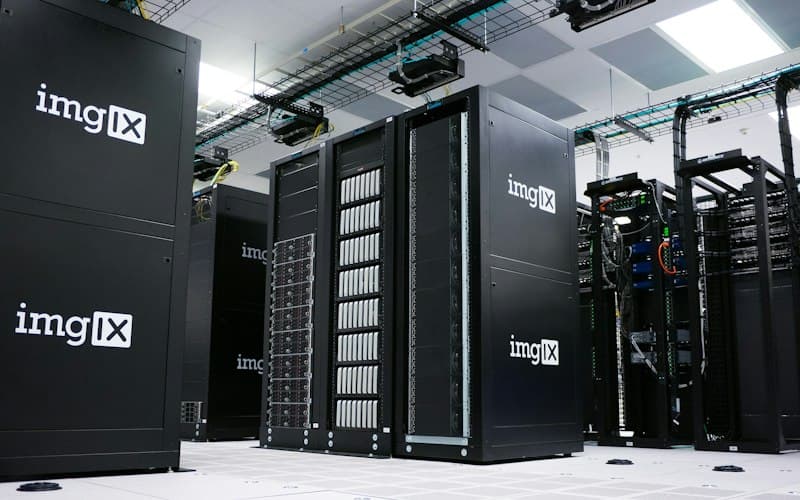
Server racks inside a data center02 / B2B SaaS

Case study 02

B2B SaaS

Grow revenue. Keep the margin.

$60K

Modeled annual EBITDA

+9.5% lift · 50% capture assumption

The opportunity.

  • Control AI usage costs.
  • Reset renewal discounts.
  • Price each plan for profit.

Modeled annual EBITDA.

Cost containment (compute)$48.1K
Price optimization$45.8K
Discount discipline$25.4K
Cost pass-through$0
Full opportunity$119K

+429 bps of annual revenue

Findings & assumptions

Three core plans plus AI and data-protection add-ons, billed per seat to six MSP customers, 1,152 invoices over 26 weeks. High gross margin hides a lot: a customer’s discount nearly tripled while its margin % barely flinched.

Annual revenue $2.78MBaseline EBITDA $626K (22.5%)
Gross margin
67.0%Baseline, annualized
Conservative impact
+214 bps$60K EBITDA / yr
AI add-on GM
−13.8 ppSince Sep 21
Quotes stopped
2 of 5Both blocked below hard floor
AI add-on: inference cost spike
−13.8 pp GM

Cloud compute rose from 5% to about 19% of the add-on’s revenue from Sep 21 (z = −5.9). Usage costs, not discounting, explain the full drop.

Action: Rate-limit or re-tier heavy usage; renegotiate inference pricing.

Harbor IT Group: price realization
10% → 25% discount

Average discount rose 15 points, but with low cost of goods GM% fell only 6 pp, so a margin-% monitor alone missed it. A dedicated discount-rate test flagged it at z = 12.5.

Action: Renewal pricing review; cap discretionary discounts by tier.

Data Protection: hosting cost increase
$1.5K lost

Storage cost per seat rose on Jul 15 with no price change. The optimizer reprices this SKU, so the leak is absorbed there.

Action: Covered by the +10% price recommendation below.

What matters

High-margin businesses need price-realization monitoring, not just margin %. That lesson changed the engine: discount-rate creep became its own detector after SaaS testing showed margin-based alerts missing it.

Price recommendations.

The optimizer does not just raise prices. Starter, Pro and the AI add-on are price-elastic enough that a 10% cut earns more margin dollars from added seats; Enterprise and Backup are inelastic and can take an increase.

SKUElasticityNet priceRecommendedVolumeGM uplift / yrCall
PLAN-STARTER1.96$25.57$23.02+23.0%$14.1KLower
PLAN-PRO1.60$52.97$47.67+18.3%$9.7KLower
PLAN-ENT1.22$87.06$95.76−10.9%$8.7KRaise
ADDON-AI3.08$22.18$19.96+38.4%$6.8KLower
ADDON-BACKUP1.27$10.56$11.61−11.4%$6.5KRaise
A craftsperson working with wood in a workshop03 / Furniture manufacturing

Case study 03

Furniture manufacturing

Make every shipment pay.

$183K

Modeled annual EBITDA

+34% lift · 50% capture assumption

The opportunity.

  • Reduce freight and install costs.
  • Reset dealer discounts.
  • Recover material cost increases.

Modeled annual EBITDA.

Cost containment (freight, install)$188.2K
Discount discipline$105.3K
Cost pass-through$66.8K
Price optimization$6.4K
Full opportunity$367K

+739 bps of annual revenue

Findings & assumptions

Seating, desks and accessories sold through six dealer accounts, 909 orders over 26 weeks. Heavy, bulky products and dealer pricing make freight and discount discipline the dominant levers.

Annual revenue $4.96MBaseline EBITDA $536K (10.8%)
Gross margin
31.6%Baseline, annualized
Conservative impact
+369 bps$183K EBITDA / yr
Orders below floor
30%141 orders under 26% GM
Quotes stopped
3 of 52 blocked, 1 routed to VP
Desks: LTL freight surge
−12.0 pp GM

Freight on desks rose 7.6 points of revenue from Sep 21 (z = −8.1); it is the largest single driver on both desk SKUs.

Action: Consolidate LTL shipments; add a freight surcharge on small desk orders.

Atlas Workplace: dealer discounting
−20.6 pp GM

Average discount climbed from 17.1% to 30.4%, which accounts for 12.3 pp of the account’s margin drop, with install labor adding 4.0 pp.

Action: Reset the dealer discount matrix; route above-matrix deals to sales leadership.

Seating: material inflation absorbed
$18.9K lost

Unit cost rose $39.20 on executive chairs and $20.30 on task chairs from Jul 1, with no price change across 103 days.

Action: Pass the increase through: the price signal is too weak for the optimizer to reprice these SKUs.

What matters

Here the money is in cost-to-serve and discount governance, not list price. Knowing when not to reprice is part of the job: the engine holds a price rather than recommend a move its data cannot support.

Price recommendations.

Large-ticket, low-frequency orders leave little price variation to learn from. The engine holds five of six SKUs instead of guessing, and recommends only where the estimate is precise enough.

SKUElasticityNet priceRecommendedVolumeGM uplift / yrCall
ACC-LAMP2.80$149.09$134.18+34.3%$6.4KLower
ACC-ARM0.80$177.51---Hold
CHR-EXEC1.06$970.25---Hold
CHR-TASK1.14$464.43---Hold
DSK-BENCH1.76$1,814.55---Hold
DSK-SIT1.35$1,206.18---Hold
Model & validation

Synthetic data. Modeled outcomes, not client results.

Annualized from 26 weeks of orders. The conservative case assumes half the modeled impact is realized. Overhead stays flat, so recovered gross margin flows to EBITDA.

IndustryRevenue / yrBaseline EBITDAModeled impactConservativeEBITDA lift
HVAC distribution$4.64M$363K (7.8%)$183K (+395 bps)$92K (+198 bps)+25%
B2B SaaS$2.78M$626K (22.5%)$119K (+429 bps)$60K (+214 bps)+9.5%
Furniture manufacturing$4.96M$536K (10.8%)$367K (+739 bps)$183K (+369 bps)+34%

How it was tested.

Generated datasets have known answers: the cost spike, discount creep, missing price increase and true price elasticity. The engine is scored against those answers and clean datasets with no planted problems.

Problems caught
96.7%58 of 60 planted margin problems flagged across 30 datasets.
False-alarm rate
2.3%Share of customers, lines and SKUs flagged on 30 clean datasets.
Onset dated
91%Caught problems dated within one week of when they actually began.
Elasticity recovered
49 / 51SKU estimates within 2 standard errors of the true value.

What testing changed.

Baseline contamination

The first version compared the latest week with the previous four, so a problem that started three weeks ago hid inside its own baseline. Detection now finds the onset week and compares against the weeks before it.

False alarms cut from 10% to 2.3%

Small accounts have noisy weekly margins. A drop now also has to be statistically significant, using order-level standard errors on the margin ratio.

Price-realization detector

SaaS testing showed discount creep barely moves GM% when cost of goods is low. A separate discount-rate test now catches it.

Inside the engine.

  1. Ingest and validate

    Transactions, cost history, direct costs and overhead from CSV, with schema and orphan checks.

  2. Attribute cost

    Date-effective unit costs, direct costs by order and overhead by revenue or unit driver. Reconciles to the cent.

  3. Detect and forecast

    Margin and discount break detection, trend forecast and Monte Carlo scenarios.

  4. Explain

    Exact decomposition of each margin change into discount, cost/mix and each direct-cost driver.

  5. Act

    Quote guardrails (approve, route to VP, block), routed alerts, price moves and an EBITDA bridge.

Assumptions: independently estimated levers may overlap; the 50% conservative case allows for that. Cost containment assumes the current cost run-rate would persist for a year. Price moves are capped at ±10% and require a sufficiently precise elasticity estimate.

Python, pandas and numpy. Inputs are standard ERP, CRM and billing CSV exports. Engine code and reported tests have not been independently verified here.

Selected work

Built to solve a problem.

MarginGuard

A price you can explain.

Submit→Validate→Approve
Every decision has an owner.

MarginGuard

Review pricing with clear checks, approvals, and a decision trail.

Supports decisions without changing live prices.
Explore the pricing workflow

marginguard / governance-console

● Demo environment

Portfolio health
Good morning, James.

Avg. proposed margin

31.8%

↑ 2.4 pts

Open recommendations

12

3 need review

Policy exceptions

2

Manager action

Margin outlook

Proposed vs. current

6-week sample

W1

W2

W3

W4

W5

W6

MarginLens

See what the numbers miss.

Explore a pricing scenario

MarginLens

Find margin gaps and test the effect of a price change.

Scenarios hold cost and volume fixed. Outcomes are not guaranteed.
SignalDesk AI Triage

Less sorting.
Better support.

Understand the requestFind the guidanceReview the reply ↗

SignalDesk AI Triage

Route support requests and draft replies for people to review.

More to explore.

Stock Signal Predictor

Explore stock signals built from market data and technical indicators.

An experiment, not financial advice.

Guarded Trend

Follow a paper-trading strategy with clear risk limits.

Source code is private.

Monte Carlo Simulator

Explore possible price paths and downside risk.

Contract Intelligence Engine

Bring key contract terms and potential risks into view.

The demo uses example contracts.

Distributed Compute Scheduler

Queue and schedule jobs around priorities and available resources.

James Boggs

About me

Built to be useful.

I turn pricing, AI, and market data into tools people can use.

Have something
in mind?

Open to remote roles in AI and analytics.

↑